Create a Microtiter Plate Heatmap
Either 96 or 48 well microtiter plate heatmaps GUI can be easily
created, customized and saved.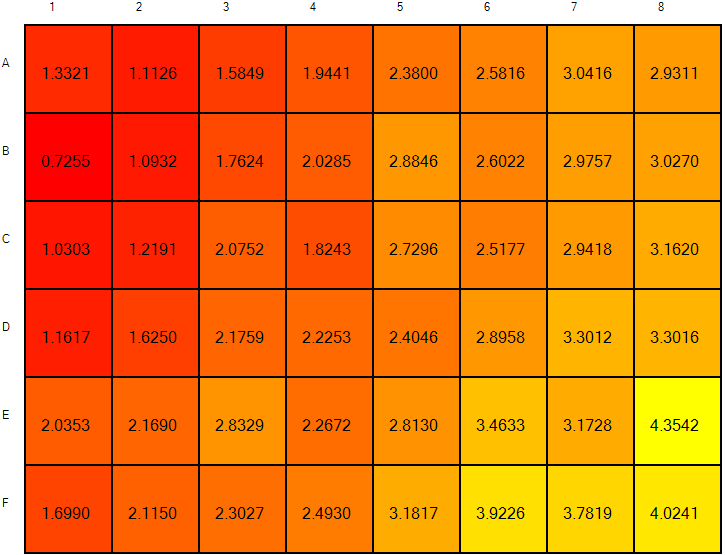
##Creates a heatmap with the estimated growth rate in each well
#This defines a class used to store name/value pairs to plot
class WellValue(object):
    def __init__(self,WellName,Value):
        #Should be A1, A2, F8, etc.
        self.name=WellName
        #Whatever numeric value one wants to plot
        self.value=Value
#Create a list to store the well value objects
wellValues=[]
#Now populate this collection with values
for gc in gcc:
     wellValues.append(WellValue(gc.DataSetName,gc.ExpFit.GrowthRate))
#Then make a new heatmap and show it
p=PlatePlot()
p.SetValuesDynamic(wellValues)
t=ShoThread(p.ShowDialog)
t.Start()
#We can also us a rainbow color scheme instead
p2=PlatePlot()
p2.SetValuesDynamic(wellValues)
p2.SwitchToRainbow()
t=ShoThread(p2.ShowDialog)
t.Start()
#We can save the image to, provided in .png
p.SaveImage("MyHeatMap.png")
Load a data file
See the inputing data page for more information about the types of files that can be loaded. See the input data page for more information on file types.
#To load a date/time format file
gcc=ImportDelimitedDataFile.ImportDateTimeCSV("MyFile.csv")
#To load a numeric format file
gcc=ImportDelimitedDataFile.ImportNumericTimeCSV("MyFile.csv")
Get AIC scores for different models
See the inputing data page for more information about the types of files that can be loaded. See the input data page for more information on file types.
gc=gcc[0]
#For the offset model
AICos=GetAIC(gc.OffSetExp)
#For the simple exponential
AICExp=GetAIC(gc.ExpFit)
#For a linear regression of the log od values
AICLin=GetAIC(gc.LinFit)
Plot all the curves
Once can easily plot all the growth curves.
hold(True)
for gc in gcc:
	PlotGrowthCurve(gc)
hold(False)
Linear regression
Linear regression is useful to check the dependence of one variable on another. Here we regress and plot the growth rate obtained from the exponential model against the growth rate obtained from the offset model.
#get offset and exponential model growth rates
expGRs=[x.ExpFit.GrowthRate for x in gcc]
offSetGRs=[x.OffSetExp.GrowthRate for x in gcc]
#now do the regression (2nd argument is dependent variable)
#and make a plot of it
regResults=doReg(expGRs,offSetGRs)
#Display some results
regResults.Rsq
regResults.PVal
regResults.Beta
regResults.BetaInt
#etc. etc.